TL;DR
- Smoothness: Flutter leaves the most spare time at 60/120 Hz; Android Native is a close second on Android. React Native is smooth at steady state but needs iOS tuning for missed frames and memory growth.
- Startup: All render a first frame in under 50 ms. Flutter is the quickest; React Native is the most consistent; iOS Native shows occasional slow outliers.
- Memory: Native uses the least memory on both platforms. Flutter is moderate and steady. React Native grows more, especially on iOS.
- Stability: Frame pacing is steady across stacks; the real challenge is staying under the frame deadline during busy moments.
- App size: Native builds are smallest; Flutter is mid-range; React Native (Expo) is largest but can be trimmed outside Expo.
- Build speed: Native rebuilds fastest. Flutter’s iOS loop is slowest but predictable. React Native sits in between.
- Data layer note: Flutter and Native used an ORM; React Native used direct SQLite with leaner payloads, small RN wins on DB timings are expected.
In this blog, we benchmark Flutter, React Native, and fully Native development (Android/iOS) using 2025-ready tooling, real-world test cases, and a scientific methodology. Our goal is not just to measure performance, responsiveness, and user experience, but also to recommend the right tool for the right context.
To make this comparison meaningful, we developed the same Flashcard Generator App using all three technologies, ensuring a consistent UI, behavior, and user experience across platforms. This approach allows us to provide practical, data-driven insights and guide you on which framework to choose and when, based on your needs and constraints.
Why Performance Still Matters (More Than Ever)
In 2025, users demand zero lag, instant loads, and battery-friendly behavior, no matter the device. Whether you’re building the next big consumer app or optimizing a mission-critical enterprise tool:
A slow app is a failed product.
The choice of development framework directly influences app performance and long-term scalability. A beautifully designed UI that stutters or drains power won’t survive in production, no matter how good the codebase looks.
That’s why we’re putting these three frameworks through real benchmarks, not just theoretical comparisons.
The Core Contenders
Flutter (Google)
- Language: Dart
- Target Platforms: Android, iOS
- UI Rendering: Custom rendering engine (Impeller)
- Key Strength: Pixel-perfect, consistent UI across platforms
Flutter takes a fundamentally different approach from traditional native rendering. Instead of relying on platform-specific UI components, Flutter renders its UI entirely through its own graphics engine. With the introduction of Impeller, Flutter’s new default renderer, it draws every frame directly to the screen using the GPU via Metal on iOS or Vulkan/OpenGL on Android.
Unlike traditional frameworks that rely heavily on the main thread for UI updates, Flutter’s architecture separates concerns across multiple threads. Impeller enhances this model by providing pre-compiled shader pipelines and a more deterministic rendering path. This helps eliminate runtime shader jank and ensures consistent, high frame-rate animations.
The result is smooth and reliable performance across platforms, especially for apps with custom UIs, rich animations, or pixel-level precision, without depending on the underlying platform’s widget set.
In theory: Flutter should be blazing fast. But does it hold up under real-world stress? Can it maintain performance without dropping frames or consuming excess memory?
React Native (Meta)
- Language: JavaScript / TypeScript
- Target Platforms: Android, iOS
- UI Rendering: Native components bridged from JS
- Key Strength: Web-like developer experience, massive ecosystem
React Native renders UI by bridging React components written in JavaScript or TypeScript to native platform views. Instead of drawing pixels directly like Flutter, React Native delegates rendering to the native UI toolkits, UIKit on iOS and ViewGroups on Android — ensuring platform fidelity and seamless integration with native APIs.
Modern React Native, powered by the Fabric renderer, introduces a streamlined, synchronous rendering path that leverages the JavaScript Interface (JSI). This architecture enables faster and more predictable UI updates by directly connecting JavaScript and native C++ objects without serialization. Layout calculation is handled by Yoga, a cross-platform Flexbox layout engine optimized for performance and consistency.
React Native components are represented internally as a tree of lightweight Shadow Nodes, which are reconciled and committed in batches to the native view hierarchy. This design enables precise control over rendering, layout, and updates.
Additionally, TurboModules allow native modules to be loaded on demand, reducing memory footprint and improving startup time. Combined with Concurrent React, Fabric enables advanced capabilities like prioritized rendering, smooth transitions, and fine-grained UI scheduling.
The result is a modern and efficient rendering engine that brings the flexibility of React together with high-performance native rendering, offering a robust foundation for scalable, interactive mobile applications.
But is React Native fast enough to compete with Flutter and Native on today’s devices?
Native Development (Android & iOS)
- Languages: Kotlin (Android), Swift (iOS)
- UI Rendering: Platform-native (Jetpack Compose, SwiftUI/UIKit)
- Key Strength: Maximum performance, full platform access
Native development leverages the platform’s built-in rendering engine and system-optimized graphics stack to deliver high-performance UIs tailored for Android and iOS. On Android, Jetpack Compose renders using the Android UI toolkit, powered by RenderThread, Choreographer, and the Skia graphics engine. On iOS, SwiftUI (or UIKit) renders directly through Core Animation and Metal, the same stack Apple uses for all system UIs.
Both Jetpack Compose and SwiftUI adopt a declarative UI paradigm, where UIs are composed of reactive state-driven functions. Under the hood, they convert composable functions into efficient view trees, track state changes through recomposition or diffing, and submit batched updates directly to the native rendering pipeline.
Jetpack Compose handles layout and rendering through a series of coordinated threads:
- UI Thread for event handling and lifecycle
- RenderThread for issuing GPU commands
- Choreographer for frame scheduling at 60/120 FPS
- Skia GPU pipeline for drawing operations
SwiftUI operates with similar elegance, backed by a system-level rendering engine:
- SwiftUI View hierarchy is compiled into render instructions
- Core Animation manages layout, animation, and rasterization
- Metal powers smooth, high-FPS rendering via GPU acceleration
This architecture ensures tight integration with the OS, smooth animations, and precise control over memory, gestures, accessibility, and GPU usage. It’s especially effective for building high-performance, responsive UIs that align seamlessly with platform guidelines and system behavior.
The result is a highly optimized native render path, purpose-built for mobile performance, with direct access to every pixel, sensor, and system capability the platform has to offer.
But how much better is native in terms of real-world performance?
How We Designed the Benchmark?
To make this comparison meaningful, we did not rely on opinions or anecdotes. We created a controlled benchmark methodology where each framework was tested with identical UI, behavior, workload, and sampling, ensuring consistent user flows on both iOS and Android.
All measurements were taken on real devices, with multiple iterations under repeatable conditions. The benchmarks tracked startup time, frame rendering stability, memory behavior, I/O operations, and dropped frames. This approach ensured that we were not only capturing raw speed but also the runtime behavior that defines real-world user experience.
By grounding the study in a transparent and repeatable methodology, our goal is to move past assumptions and provide practical, data-driven insights into when to choose Flutter, React Native, or Native.
Our study combined two perspectives:
- The Flashcard AI app demonstrated developer experience, architectural choices, and integration complexity.
- A dedicated List Rendering Benchmark provided a controlled environment to measure runtime performance under identical workloads.
This study focuses on runtime behavior rather than feature parity.
All benchmark harnesses and the Flashcard demo app are available in our Github Repository:
For stable results use the device configs listed below.
Disclaimer on Benchmarking Limitations:
While every effort was made to control environmental factors during testing, such as battery level, background processes, thermal state, and device configuration. It’s important to acknowledge that mobile application performance benchmarking can never be entirely free from exogenous variables. Factors like OS-level scheduling, hardware-specific optimizations, and runtime variability across platforms inevitably introduce some degree of noise. Our goal is not to claim absolute performance truths, but to present repeatable, well-controlled comparisons relative performance trends
Building the Flashcard AI App
To explore developer experience, we built the same Flashcard Generator AI app in Flutter, React Native, and Native (Swift for iOS and Kotlin for Android). The app connects with the OpenAI API to generate flashcard decks, organizes them in a clean UI, and follows a clean code architecture to keep logic, UI, and data layers separate.
This gave us a real-world way to test:
- Architecture fit: How each framework supports clean code practices and modularity
- Integration experience: How smooth it was to work with APIs like OpenAI for flashcard generation
- UI development: How quickly we could design and implement card-based layouts with responsive interactions
- Developer workflow: How the ecosystem, tooling, and language shaped speed and productivity
Flashcard App Demo
Working across all three frameworks highlighted important trade-offs. Here’s what our team learned from the experience, and how each platform stacked up in real development:
- Flutter makes it remarkably straightforward to deliver perfect UIs from a single codebase. While certain platform-specific behaviors can be challenging to fine-tune across iOS and Android, the framework largely smooths over these differences. For developers coming from a native Android or iOS background, Flutter’s widget nomenclature and the architecture around decorators may initially feel unfamiliar. However, with the support of modern IDEs and AI-assisted tools, the learning curve is far less daunting, and the overall development experience feels both intuitive and efficient. Dart itself is approachable, with a syntax that feels familiar and easy to pick up.
- React Native felt instantly familiar and easy to pick up. With just a bit of exploration through the documentation, we were able to get things built and running quickly. Expo simplified the process even further: handling builds, deployment, and setup with remarkable ease, at least until we ventured into native modules. To be fair, the team working on this had no prior experience with React Native (intentionally), which amplified the challenges. They found themselves wrestling with the Expo ecosystem, spending an entire day navigating pre-builds and debugging generated code before finally getting everything operational. While this isn’t the typical perception of React Native, in our case, the struggle was undeniably real.
- Native Android development felt like returning home, but to a renovated one. Jetpack Compose introduced a declarative UI paradigm that felt modern and enjoyable, and the team took to it quickly. With their familiarity in the native Android ecosystem, working with tightly integrated platform APIs and tools felt almost effortless. On the iOS side, the experience was even smoother. Although the developer assigned to this task had no prior exposure to Swift (intentionally), the iOS development environment proved more approachable and required less setup time than its Android counterpart. Unlike Android, there were no frustrating Gradle errors or dependency issues to resolve, which made iOS development a pleasant surprise.
This exercise surfaced what it feels like to build and ship in each ecosystem. But developer experience is only one side of the story.
To understand how these frameworks perform under pressure, we designed a dedicated List Rendering Benchmark. This allowed us to test runtime behavior under identical conditions, removing subjective impressions and focusing on measurable outcomes.
Technical Benchmark Details
To measure runtime performance objectively, we created a dedicated List Rendering Benchmark Screen in each framework: Flutter, React Native, Swift (iOS), and Kotlin (Android).
This benchmark was carefully designed to be consistent and reproducible across all implementations:
- Rendered a fixed set of 100 list items per run
- Automated the scrolling process for uniformity
- Repeated the benchmark three times per framework and platform
- Applied identical layouts and scroll distances in every case
- Measured startup latency, rendering smoothness, and memory usage
- Followed each framework’s best practices while keeping implementations functionally equivalent
By isolating list rendering, we removed higher-level app variability and focused solely on rendering efficiency, giving us a clear picture of how each framework behaves under the same workload.
Devices and Environment
All benchmarks were executed on physical devices under controlled conditions to ensure consistency:
To maintain fairness across runs, the environment was carefully controlled:
- Battery level kept above 80 percent
- Minimal background processes active
- Stable thermal state to avoid throttling
- Minimal network activity
To keep things fair, we tested Android on the Galaxy Z Fold 6 with its silky 120 Hz Dynamic AMOLED 2X display: the best hardware we could get our hands on, so the device itself wasn’t the bottleneck. iOS, on the other hand, ran on the iPhone 16 Plus, which still tops out at 60 Hz.
For all the number crunching, we normalized performance against each panel’s refresh target, so the comparison stays clean.
That said,
Dear Apple, maybe it’s time every $1,000+ iPhone gets 120 Hz. ProMotion shouldn’t require a “Pro” suffix, smoothness is a human right, not a product tier.
Parameters Measured
Our benchmark captured both runtime performance and build/runtime resource characteristics.
Runtime Metrics
- Startup Time (TTFF): Time to first frame rendered after app launch, with standard deviation across runs.
- Frame Rendering: Average frame time, 95th percentile frame time (P95), actual FPS (clamped and unclamped), dropped frames percentage, and janky frames percentage.
- Frame Stability: Coefficient of Variation (CoV) of frame times, reflecting smoothness.
- Total Frames: Number of frames produced during the scroll benchmark.
- Scroll Performance: Distance scrolled (px) and average scroll duration (ms).
Memory Metrics
- Memory Delta (MB): Increase in memory usage during the benchmark.
- Memory per Item (KB): Memory cost per rendered list item.
- Memory Stability: Standard deviation of memory usage across iterations.
Build & Binary Metrics (collected manually, outside runtime execution)
- Binary Size: Final build size in MB for both iOS and Android.
- Build Time: Average time to produce a build, measured in seconds.
Formulas Used
To ensure consistency across frameworks, the following formulas were applied when calculating benchmark metrics:
Startup Time (TTFF)
Time difference between app launch and first rendered frame.
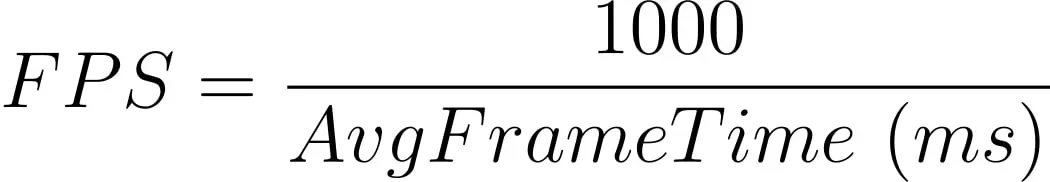
Frames Per Second (FPS)
Converts average frame time into effective frame rate.
95th Percentile Frame Time (P95): Extracted as the frame time below which 95 percent of samples fall, to capture tail latency.
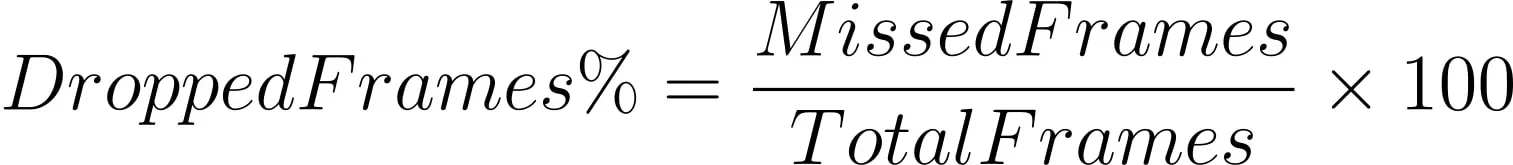
Dropped Frames %
Janky Frames %
Where threshold = 16.67 ms (for 60 Hz) or 8.33 ms (for 120 Hz).
Memory Delta (MB)
Memory per Item (KB)
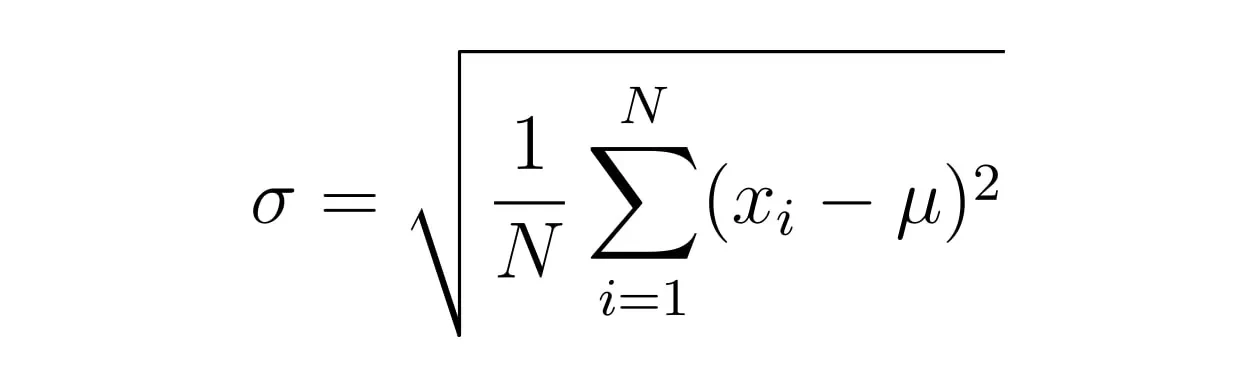
Coefficient of Variation (CoV)
Ratio of standard deviation (σ) to mean frame time (μ), indicating frame stability.
Measurement Tools
iOS Native (Swift + Obj-C)
- Frame timing:
CADisplayLink deltas from the display callback. - Refresh info:
CADisplayLink.preferredFrameRateRange (iOS 15+) for min/max/preferred Hz. - Memory: Mach task APIs via
task_info(..., MACH_TASK_BASIC_INFO / TASK_VM_INFO) to get RSS and related fields.
Android Native (Kotlin/Compose)
- Frame timing:
android.view.Choreographer frame callbacks to collect per-frame durations. - Memory:
Debug.getMemoryInfo() for PSS plus ActivityManager.getMemoryInfo() for system snapshot.
Flutter (Dart)
- Frame timing:
SchedulerBinding.instance.addTimingsCallback capturing FrameTiming records. - Memory:
ProcessInfo.currentRss (Dart dart:io) for process RSS.
React Native (JS + NativeModules)
- Bridge modules:
NativeModules.FrameProfiler (frames) and NativeModules.MemoryProfiler (memory) call into the iOS/Android native code. - Note: We are not using JSI hooks, Fabric renderer internals, or Yoga layout metrics for profiling. Metrics flow over the classic RN bridge from those native modules.
Benchmark Results (2025): Flutter vs React Native vs Native
With the setup locked, we move from lab notes to lap times. All charts below clearly distinguishes each display’s refresh target (16.7 ms @60 Hz, 8.3 ms @120 Hz) to reflect true, user-visible smoothness.
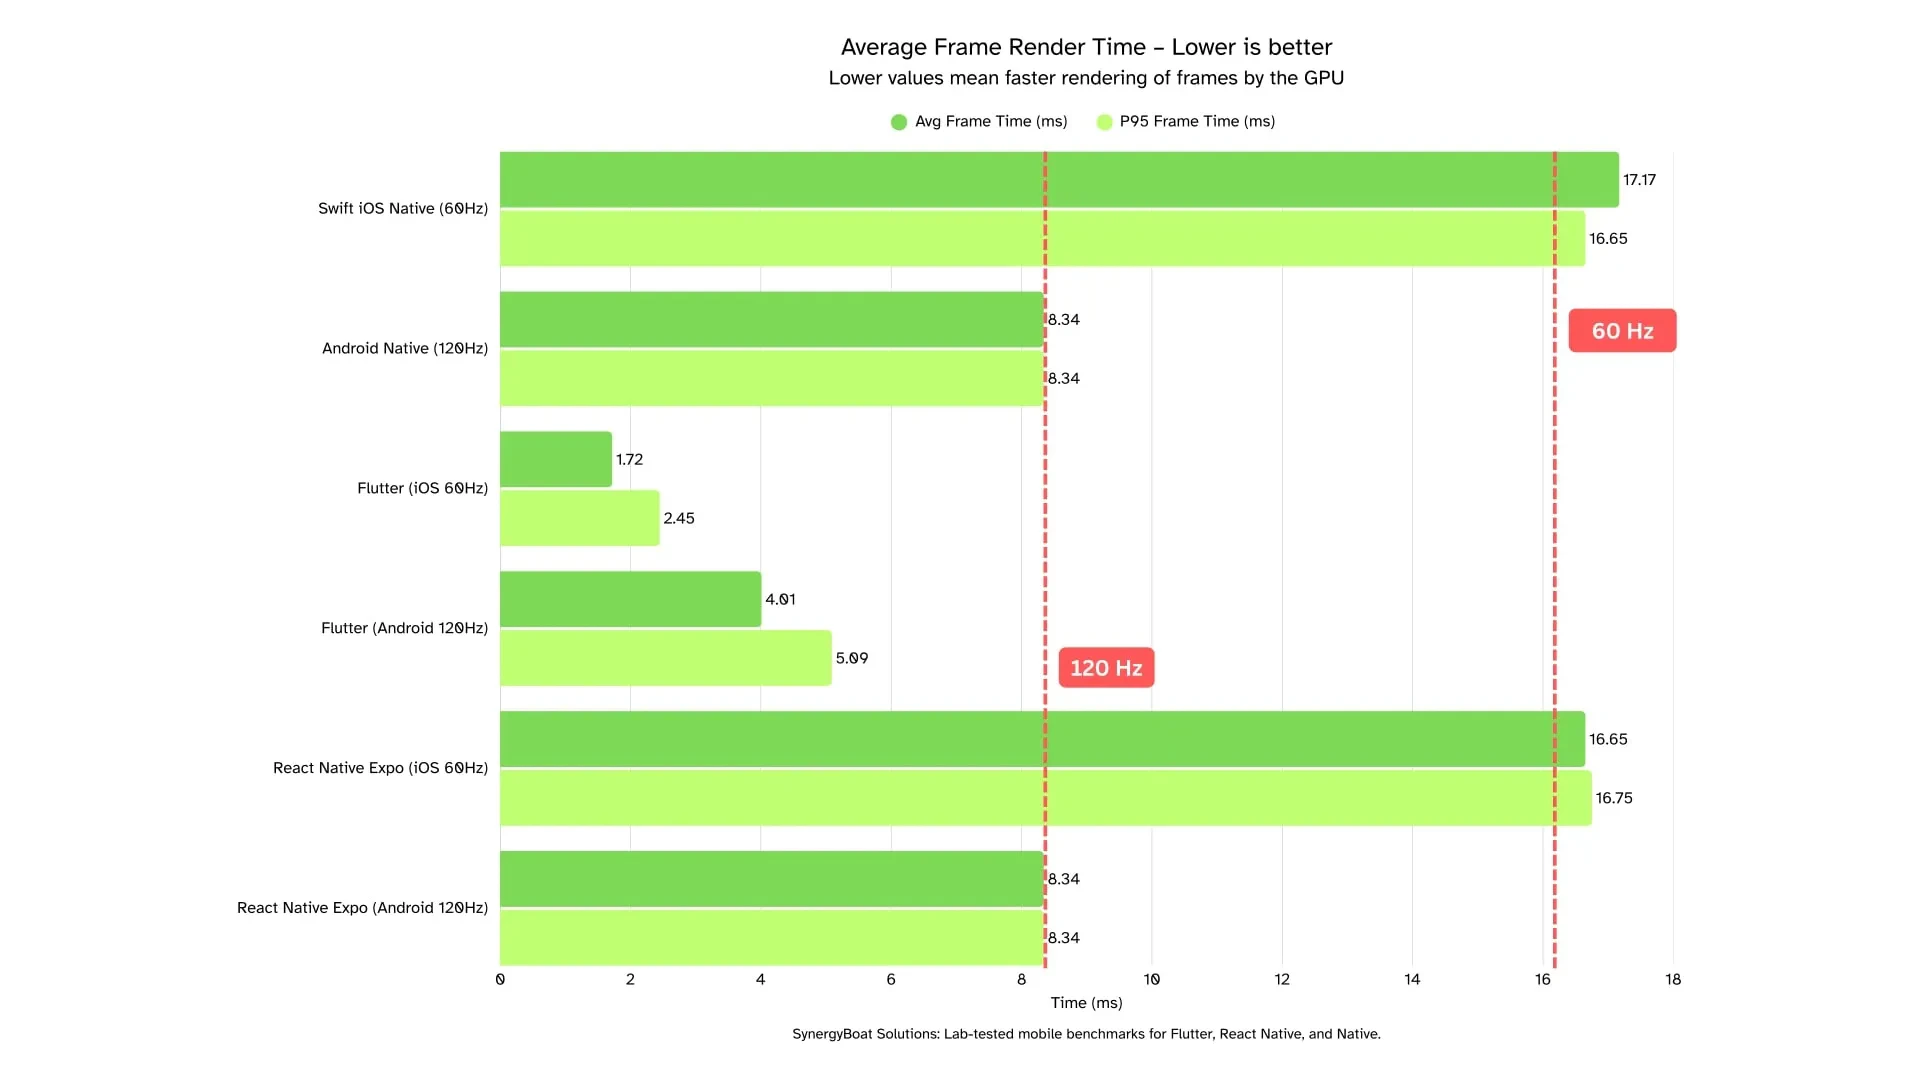
Average Frame Render Time
Average Frame Render Time is the mean time your app takes to produce each frame during the test run. Think of it as the “cruising speed” of your UI. Lower is better, and it directly maps to perceived smoothness. It’s a solid health check for overall rendering efficiency and a good way to spot broad regressions (layout work, heavy decoding, overdraw).
However, averages can be charmingly deceitful: they hide stutters and hitching that users actually feel. Use it alongside tail metrics (p95), DroppedFrame%, and Jank% to see the whole picture, and always read it against the frame budget (≈16.7 ms at 60 Hz, ≈8.3 ms at 120 Hz).
Practical rule of thumb: Keep your average comfortably below the budget (e.g., ≤14 ms at 60 Hz, ≤7 ms at 120 Hz) to preserve headroom for GC, I/O, and animation spikes, because smooth isn’t the average, it’s the experience.
V-Sync Note (Render Time & FPS Capping): Mobile UIs are synchronized to the display’s v-sync, so frames can only appear at fixed intervals i.e. ~16.7 ms at 60 Hz and ~8.3 ms at 120 Hz. If a frame finishes early, it simply waits for the next v-sync. Users won’t see “extra” frames. In Flutter, FrameTiming exposes engine-side build and raster durations that aren’t v-sync-capped, so you can see true rendering effort. In iOS/Android native and React Native (with CADisplayLink/Choreographer), our timestamps are v-sync-aligned, so an on-time frame may still report near the budget even if it completed earlier.
Practical reading: Judge Average Frame Render Time against the frame budget, and pay special attention to bars that cross the red line. Those are missed v-sync deadlines (jank). Sub-budget bars indicate headroom and stability, not higher visible FPS (no medals for “200 FPS on a 60 Hz screen”).
How to read this: Averages are v-sync–aware on native/RN (they cluster near the frame period), while Flutter’s engine timings reflect actual render work, so sub-budget numbers indicate headroom, not higher visible FPS.
Insights:
iOS (60 Hz, budget ≈ 16.7 ms)
- Flutter: (Avg 1.72 ms, p95 2.45 ms) Huge headroom; tails are comfortably sub-budget.
- React Native: (Avg 16.65 ms, p95 16.75 ms) Right at the budget, stable but little margin for spikes (GC/decodes).
- Swift (Native): (Avg 17.17 ms, p95 16.65 ms) Average is over budget while p95 is just under it, implying a small set of very slow frames skewing the mean.
Android (120 Hz, budget ≈ 8.3 ms)
- Flutter: (Avg 4.01 ms, p95 5.09 ms) Comfortably sub-budget (≈ 41–61% of the budget). Strong headroom and stable tails. Low jank risk at 120 Hz.
- React Native: (Avg 8.34 ms, p95 8.34 ms) Right at the frame budget (v-sync limited). Smooth at steady state, but no safety margin for GC/decodes or image bursts.
- Android Native (Kotlin): (Avg 8.34 ms, p95 8.34 ms) Also budget-bound. Smooth now, but any extra UI-thread work can tip frames over 8.3 ms.
Dropped and Janky Frames
Dropped Frames Percent is the share of frames that miss their v-sync deadline entirely and are not presented on time. Janky Frames Percent is the share of frames that exceed the frame budget but still show up on the next v-sync. Lower is better for both. These metrics reveal the stutters users actually feel. Use them to catch GC spikes, image decode stalls, layout bursts, or bridge contention that a good average can hide.
However, single percentages can be charmingly deceitful. Read them alongside p95, Average Frame Render Time, and your frame budget (≈16.7 ms at 60 Hz, ≈8.3 ms at 120 Hz)
Practical rule of thumb: Keep Jank% under 1 to 2 percent and DroppedFrames% well under 1 percent for sustained scrolls. Anything above that is noticeable in production.
How to read this: DroppedFrames% captures missed presentations. Jank% captures frames that exceeded the budget. Zeroes mean the pipeline met its deadlines. Non-zero values point to contention on the UI, JS, or decode paths. Interpret these alongside p95 and Average Frame Render Time to separate steady-state smoothness from stress behavior.
Insights:
iOS (60 Hz, budget ≈ 16.7 ms)
- Flutter: (Dropped 0%, Jank 0%)
No missed slots and no over-budget frames. Excellent headroom. - React Native: (Dropped 15.51%, Jank 1.8%)
High DroppedFrames% indicates frequent missed v-sync under scroll. - Swift (Native): (Dropped 1.61%, Jank 1.413%)
Small but noticeable tails. Review occasional layout or decode spikes.
Android (120 Hz, budget ≈ 8.3 ms)
- Flutter: (Dropped 0%, Jank 0%)
Clean run with strong timing margin at 120 Hz. - React Native: (Dropped 0%, Jank 0%)
At-budget averages with no measured misses in this scenario. - Android Native (Kotlin): (Dropped 0.038%, Jank 0%)
Essentially zero drops. Any separation will show up in p95 on longer or heavier runs.
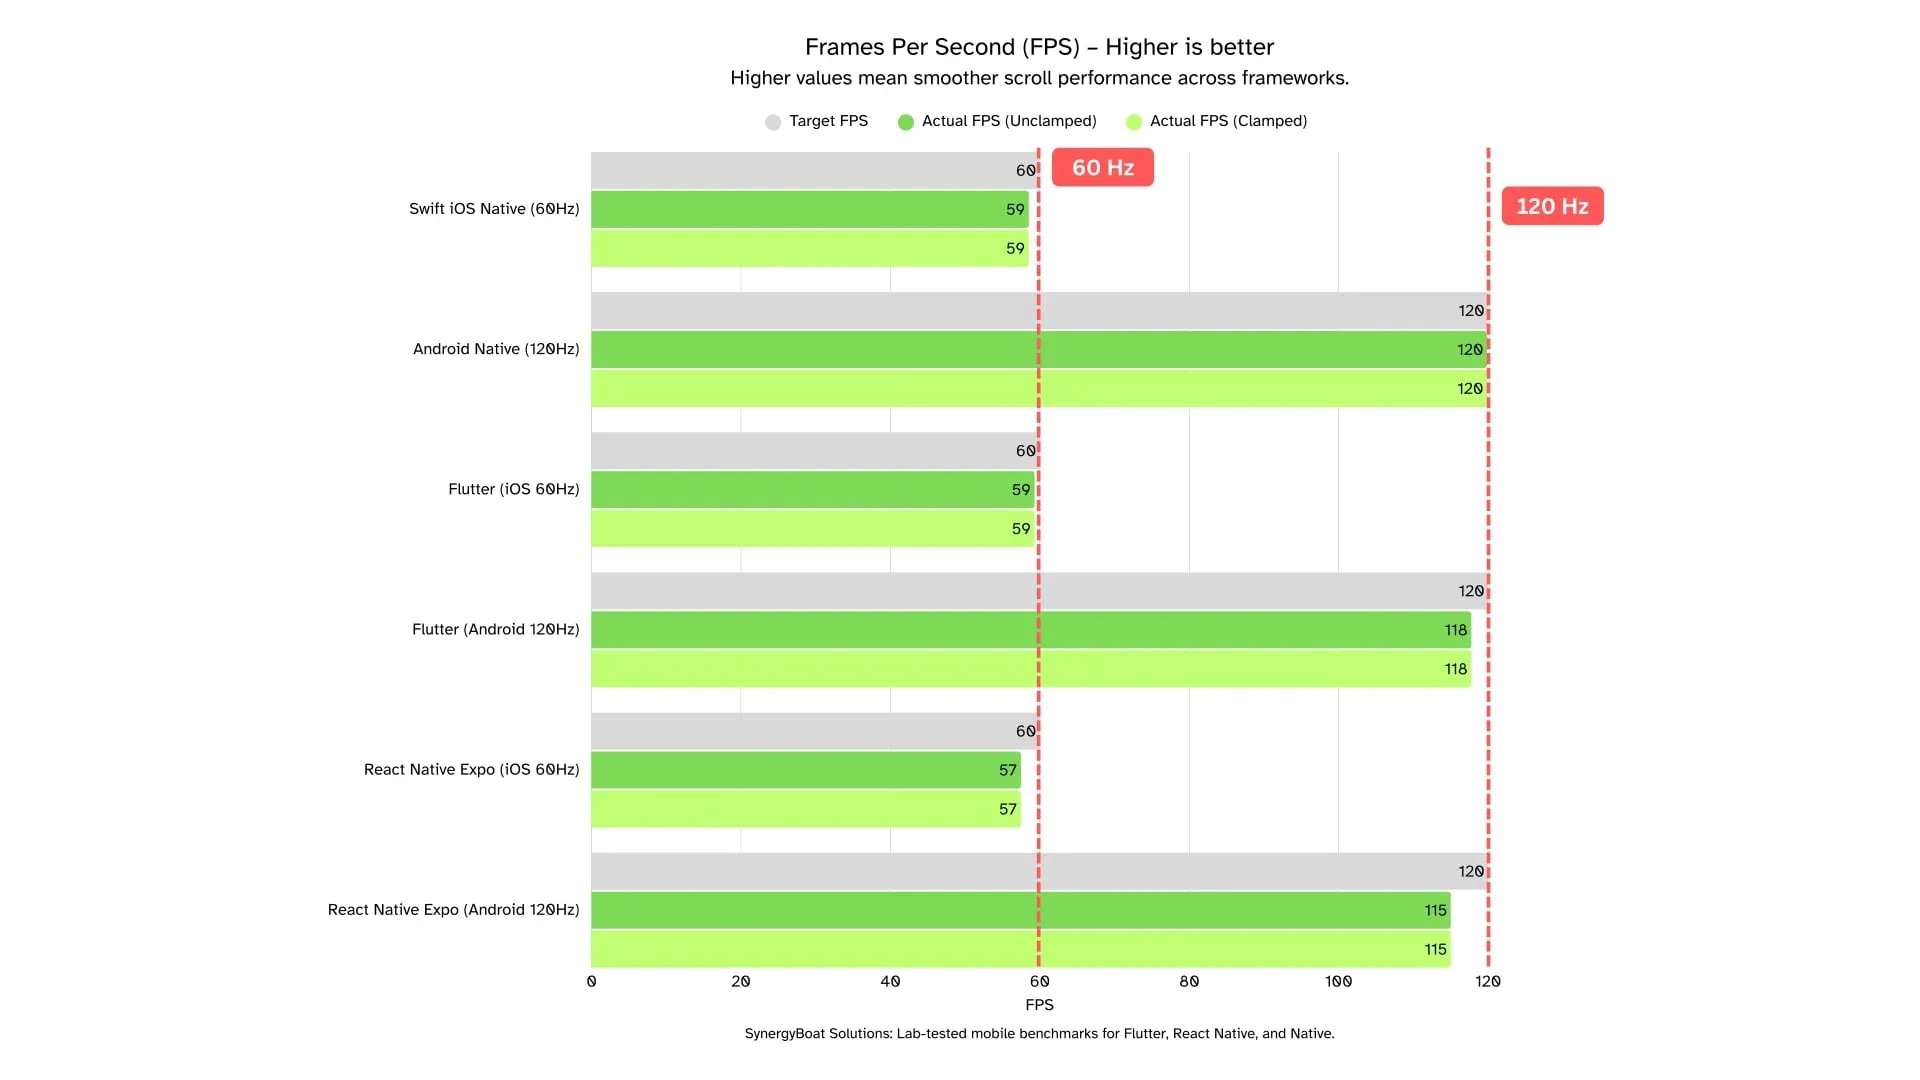
Frames Per Second
FPS is the number of frames the app actually presents per second during the test run. It is the presentation rate users see. Higher is better, up to the device’s refresh ceiling. It is a solid health check for steady-state smoothness and a quick way to spot underutilization of the frame budget.
However, it hides stutters and hitching that appear as tail events. Read FPS together with p95, Average Frame Render Time, DroppedFrames%, and Jank%, and always compare against the panel ceiling (60 or 120 Hz).
Practical rule of thumb: Aim for ≥ 98% of the panel refresh under sustained scroll when tails are also clean.
V-Sync Note (Clamped vs Unclamped): Mobile displays present frames in v-sync slots only. Because our runs stayed within the budget most of the time, Unclamped and Clamped FPS are identical here. Sub-budget frame times do not raise visible FPS beyond the panel limit. Use FPS as a presentation sanity check, and use frame time and p95 to understand real headroom.
Insights:
iOS (60 Hz, ceiling 60)
- Flutter: (Actual 59.31, Clamped 59.31)
~98.85% of ceiling. Aligns with zero drops and zero jank. Excellent headroom. - React Native: (Actual 57.49, Clamped 57.49)
~95.82% of ceiling. Matches the elevated DroppedFrames% earlier. Investigate JS thread pressure and image decode. - Swift (Native): (Actual 58.54, Clamped 58.54)
~97.57% of ceiling. Small shortfall consistent with light tails.
Android (120 Hz, ceiling 120)
- Flutter: (Actual 117.75, Clamped 117.75)
~98.13% of ceiling. Clean presentation with strong timing margin. - React Native: (Actual 115, Clamped 115)
~95.83% of ceiling. Smooth to the eye in this run, but below ideal. Check p95 and jank on longer traces. - Android Native (Kotlin): (Actual 119.84, Clamped 119.84)
~99.87% of ceiling. Essentially perfect presentation.
How to read this: FPS is the visible outcome of meeting v-sync deadlines. Equality of Unclamped and Clamped confirms v-sync capping. Use FPS to confirm presentation quality, then rely on p95 and Average Frame Render Time to diagnose headroom and the real causes of any drops.
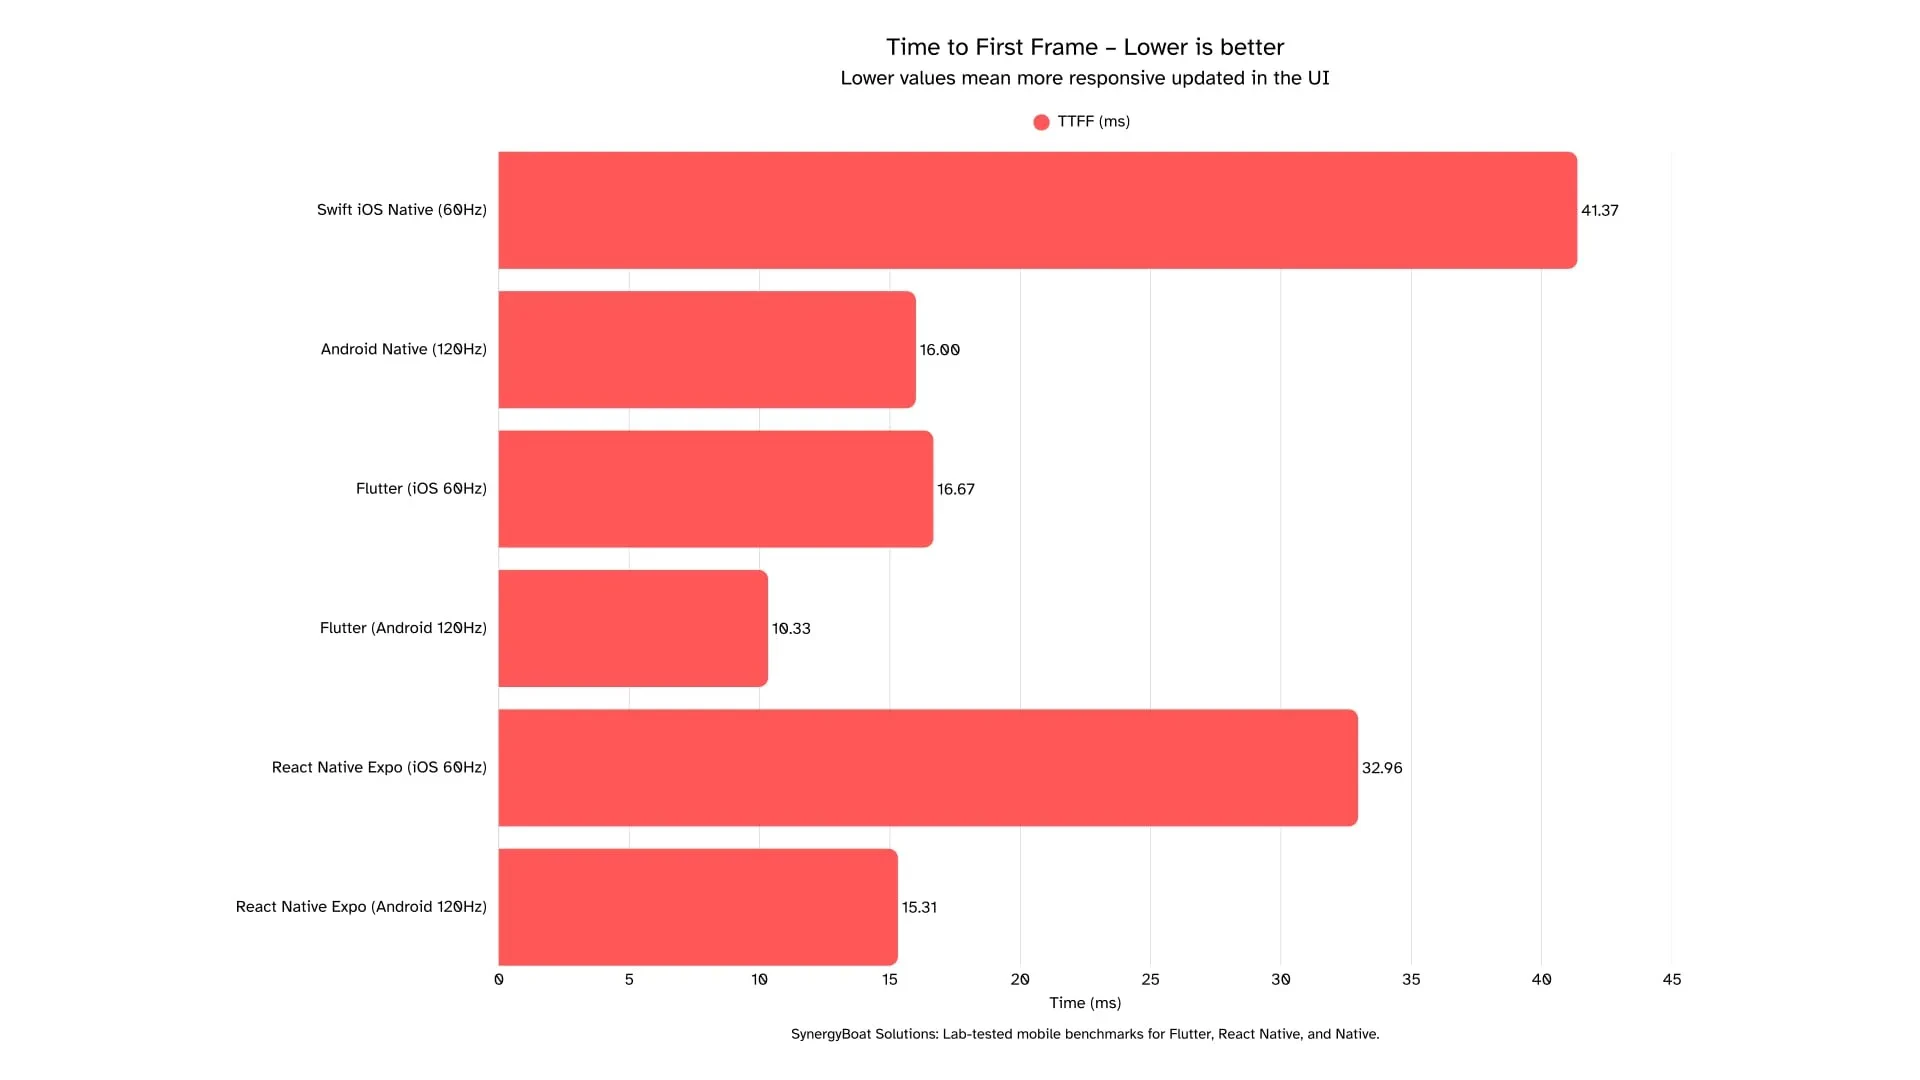
Time to First Frame (TTFF)
Time to First Frame (TTFF) is the time from launch to the first presented frame. Lower is better. It sets the very first impression of snappiness and is a solid health check for startup work like runtime initialization, dependency injection, and initial layout.
Look at StdDev to understand stability across runs and read TTFF alongside Average Frame Render Time, p95, DroppedFrames%, and Jank%.
Practical rule of thumb: Aim for TTFF that feels instant to the eye. Sub-50 ms reads as immediate. Keep StdDev tight so users do not occasionally see a slower first paint.
Launch Semantics Note (Cold vs Warm): TTFF depends on what is initialized before the first frame. Warm starts, cached assets, and prewarmed engines reduce TTFF. Cold starts, heavy module initialization, and synchronous I/O increase it.
Insights:
iOS (60 Hz)
- Flutter: (TTFF 16.67 ms, StdDev 1.25 ms)
Very fast and very consistent. Startup pipeline is lean before first paint. - React Native: (TTFF 32.96 ms, StdDev 0.16 ms)
Slower than Flutter but extremely stable. Good predictability for first paint. - Swift (Native): (TTFF 41.37 ms, StdDev 54.75 ms)
Average is acceptable, variance is not. Occasional slow paths skew the experience.
Android (120 Hz)
- Flutter: (TTFF 10.33 ms, StdDev 4.5 ms)
Fastest first paint with some variability. Still reads instant. Profile the few slower runs. - React Native: (TTFF 15.31 ms, StdDev 0.46 ms)
Slightly slower than Flutter but very consistent. Predictable first paint. - Android Native (Kotlin): (TTFF 16 ms, StdDev 0 ms)
Essentially quantized and rock-steady. Startup path is clean and repeatable.
How to read this: TTFF is your first impression metric. Use StdDev to judge if that impression is consistent. If TTFF looks great but StdDev is high, users will sometimes feel a slow start even if the average looks fine.
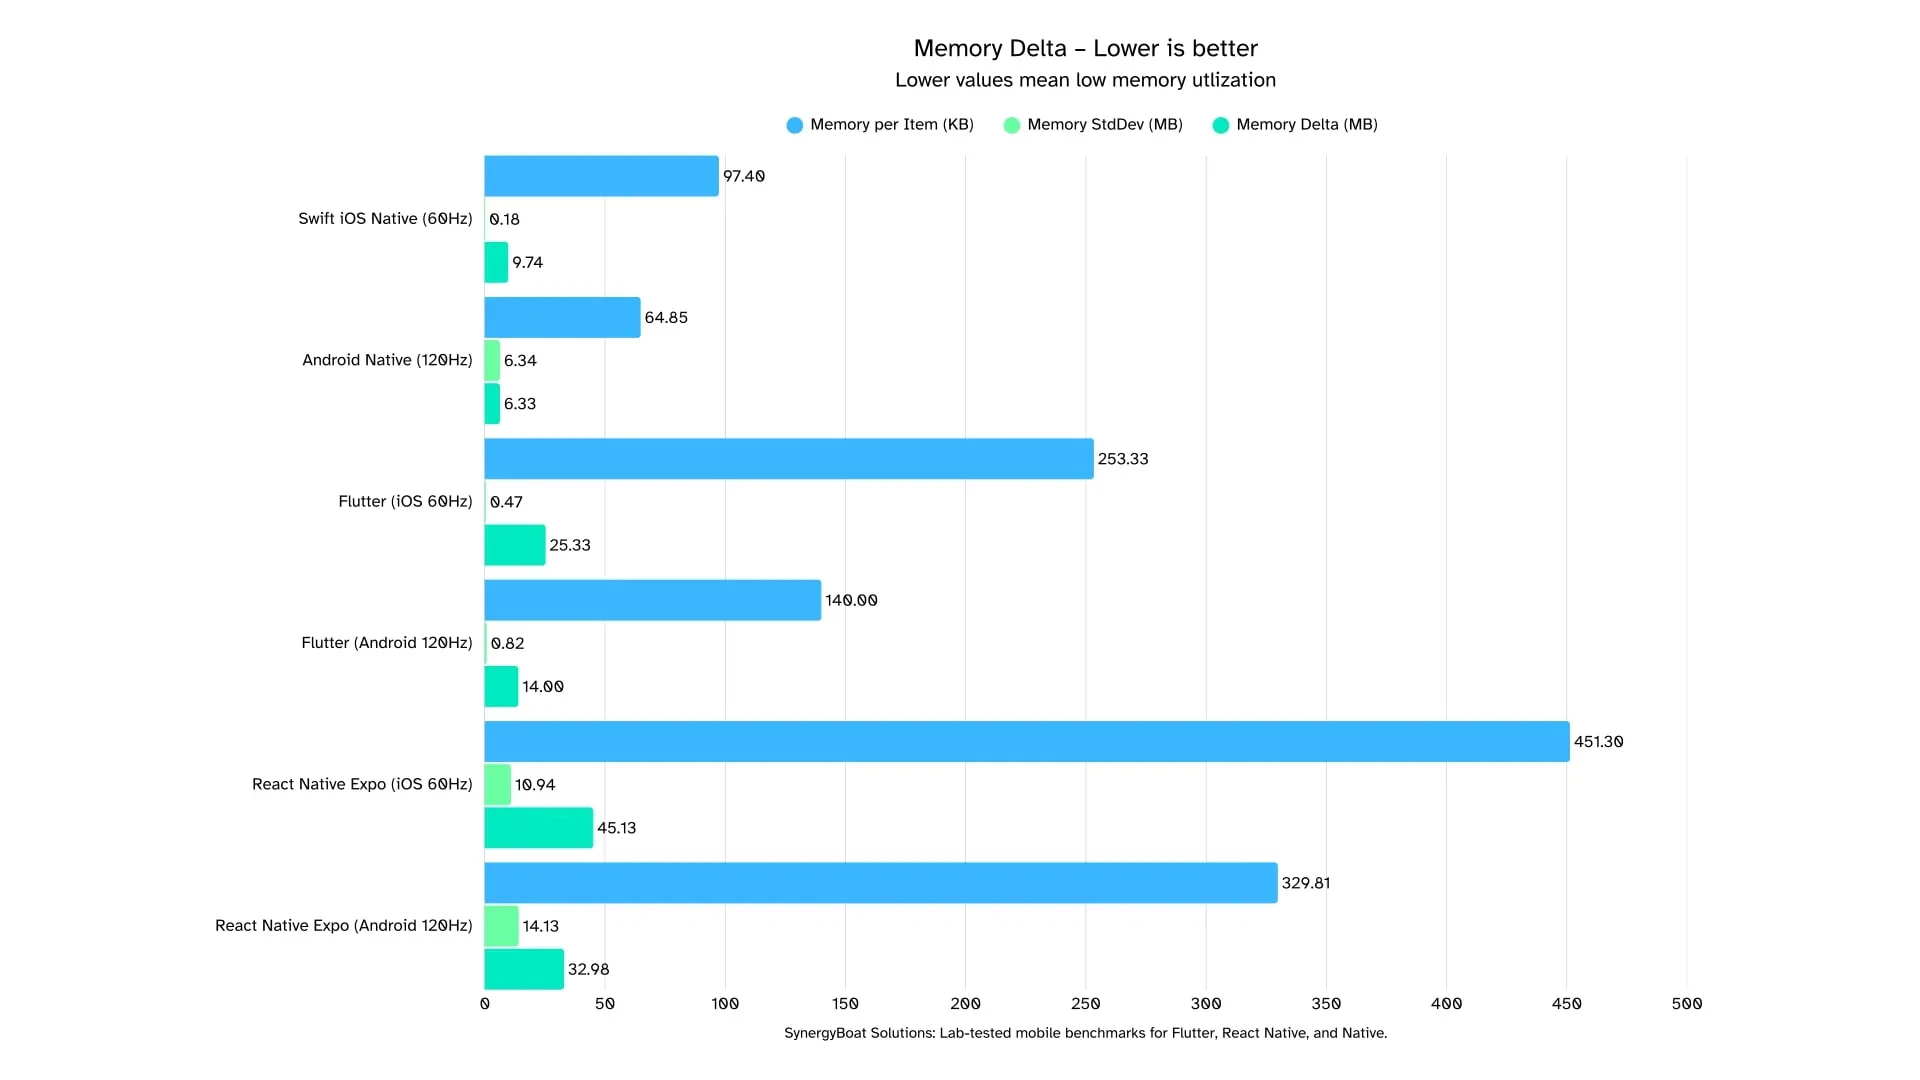
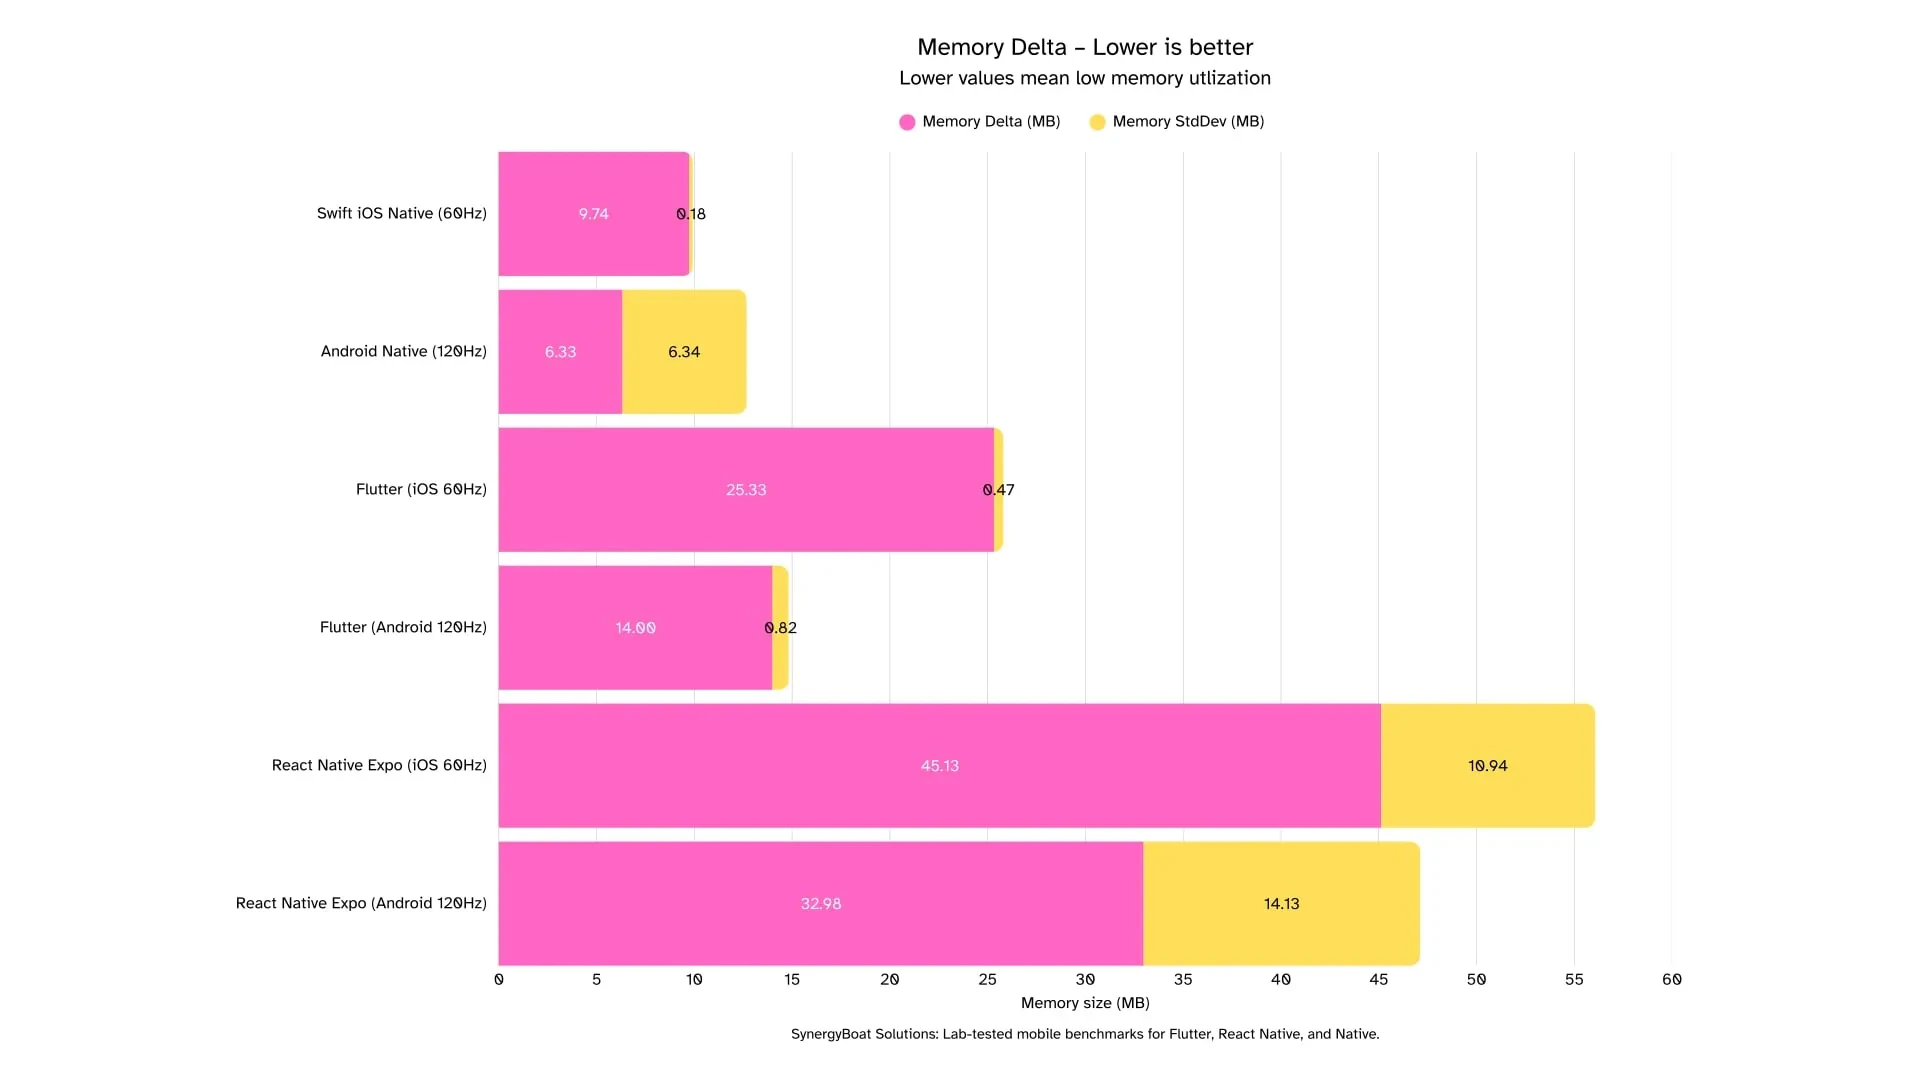
Memory Delta
Memory Delta is the increase in process memory during the benchmarked action. Lower is better. It reflects allocations created by rendering, data structures, images, and caches that come alive while the list scrolls.
However, single deltas can be misleading. Always read StdDev to judge stability across runs, and compare within each OS because iOS and Android report memory differently.
Practical rule of thumb: Keep ΔMemory in the low teens for simple scrolls and keep StdDev small so growth is predictable.
Memory Metric Note (RSS vs PSS): iOS reports RSS and Android reports PSS. These are not directly comparable. Use within-platform deltas for fairness and call out the metric in tables so no one mixes apples with Androids.
Insights:
iOS (60 Hz)
- Flutter: (ΔMemory 25.33 MB, StdDev 0.47 MB)
Moderate growth with very tight variance. Headroom is good and behavior is consistent. - React Native: (ΔMemory 45.13 MB, StdDev 10.94 MB)
Highest growth and high variability. - Swift (Native): (ΔMemory 9.74 MB, StdDev 0.18 MB)
Small and stable footprint. Allocations look disciplined.
Android (120 Hz)
- Flutter: (ΔMemory 14.00 MB, StdDev 0.82 MB)
Low growth with tight variance. Healthy profile for a scrolling workload. - React Native: (ΔMemory 32.98 MB, StdDev 14.13 MB)
Elevated growth with large variance. Bursty allocations suggest cache churn or GC-sensitive paths. - Android Native (Kotlin): (ΔMemory 6.33 MB, StdDev 6.34 MB)
Low average with high variance. Occasional spikes offset otherwise small growth.
How to read this: ΔMemory shows how heavy a screen becomes as it works. StdDev separates steady growth from spiky behavior. Interpret results alongside Average Frame Render Time, p95, DroppedFrames%, and Jank% to see whether memory pressure aligns with visual hitches.
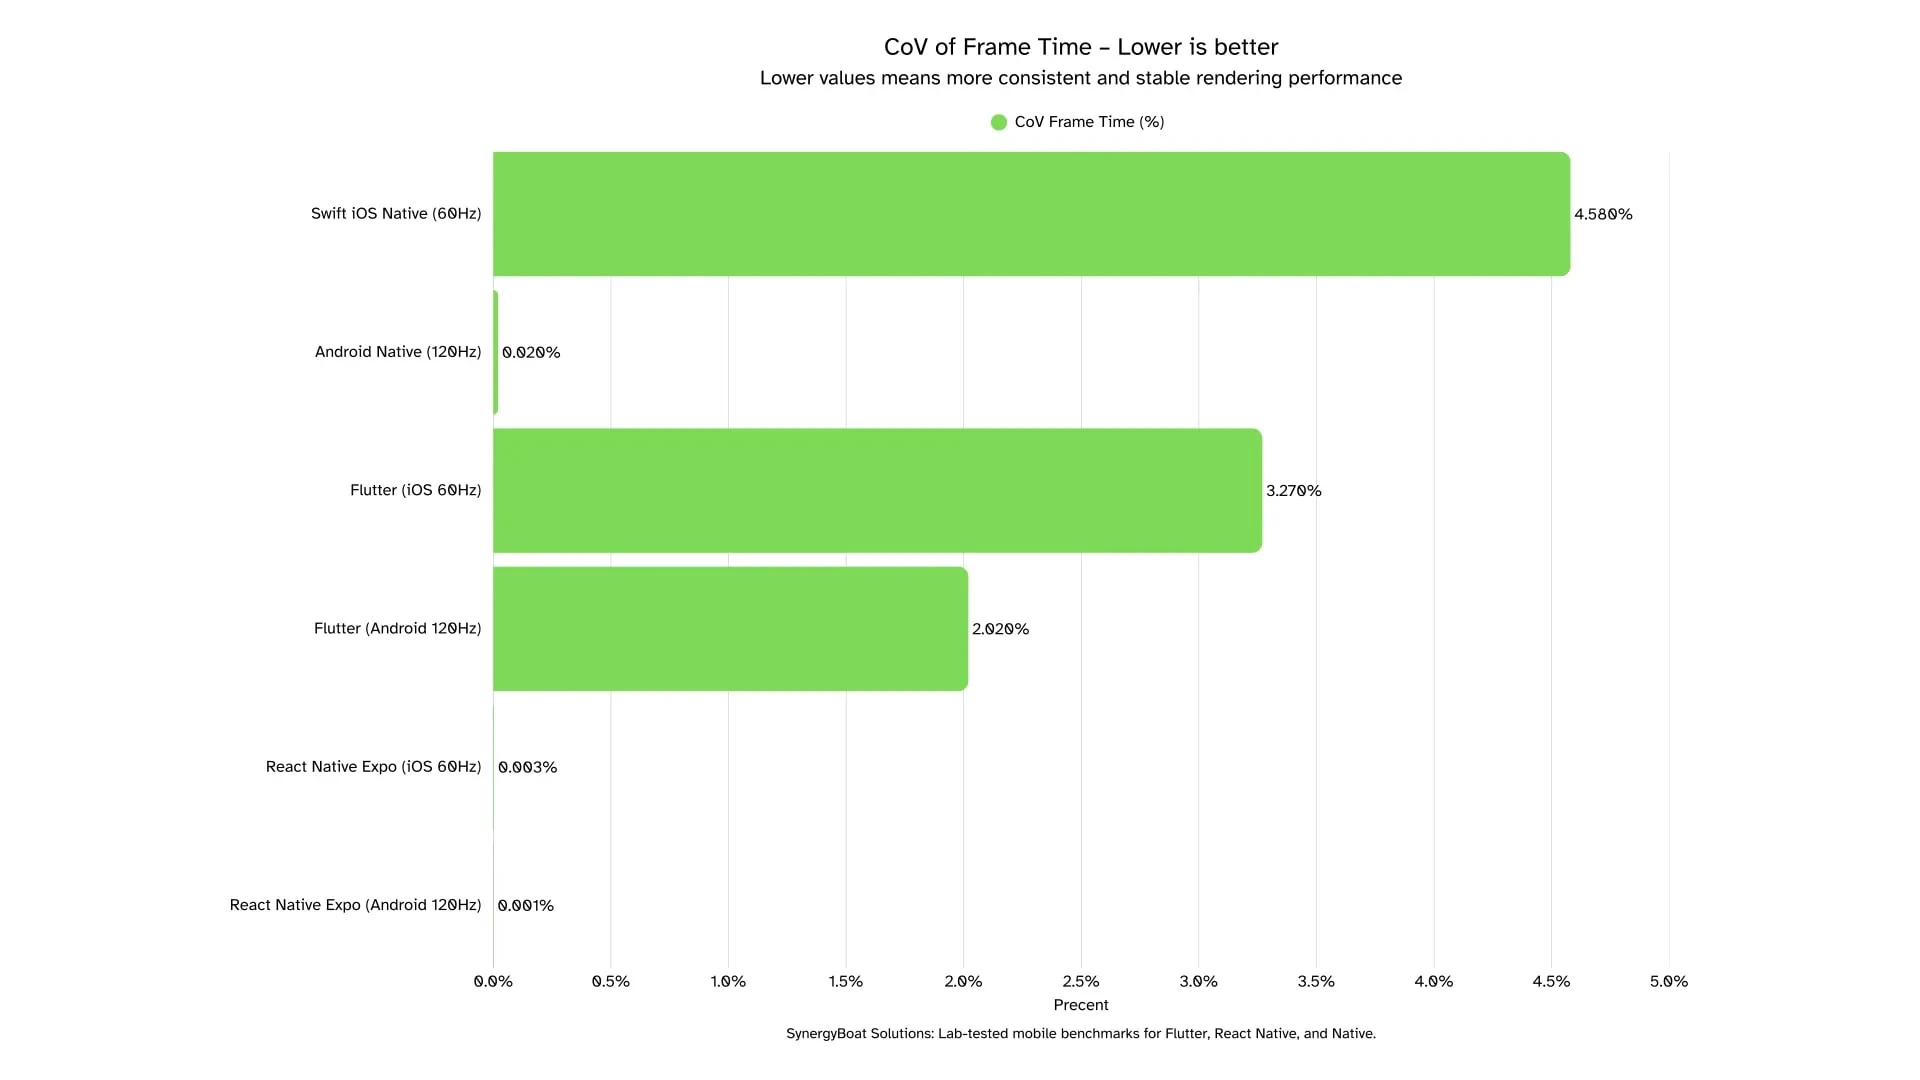
Coefficient of Variation (CoV) of Frame Time
Coefficient of Variation (CoV) of Frame Time is the ratio of the standard deviation to the mean frame time, expressed in percent. Lower is better. It captures frame-to-frame stability, which maps to perceived smoothness. It is a solid health check for pacing consistency and a good way to spot micro-hitches even when averages look fine.
Read them alongside p95, Average Frame Render Time, DroppedFrames%, and Jank%, and always compare against the frame budget (≈16.7 ms at 60 Hz, ≈8.3 ms at 120 Hz).
Practical rule of thumb: Keep CoV in the low single digits for sustained scrolls. If CoV rises above 5 percent on 60 Hz or 3 percent on 120 Hz, expect visible inconsistency.
Variability Note (Quantization and sample size): V-sync quantization can compress dispersion when frames cluster near the budget, and small sample sizes can make CoV look artificially tiny. Practical reading: treat CoV as a stability lens, not a pass score. Confirm with p95 and JankFrames% and DroppedFrames%.
Insights:
iOS (60 Hz)
- Flutter: (CoV 3.27%)
Low variability. Pairs well with sub-budget averages and clean tails. - React Native: (CoV 0.003%)
Ultra-low dispersion, yet remember earlier DroppedFrames% on iOS. Stable pacing does not guarantee meeting the budget. Verify with p95 and drops. - Swift (Native): (CoV 4.58%)
Moderate variability. Occasional pacing wobble is consistent with light tails.
Android (120 Hz)
- Flutter: (CoV 2.02%)
Low and steady at 120 Hz. Consistent motion with headroom. - React Native: (CoV 0.001%)
Essentially zero dispersion in this run. Stability is excellent. Confirm headroom with p95. - Android Native (Kotlin): (CoV 0.02%)
Near-perfect stability. Any separation will show in tail metrics on heavier runs.
How to read this: CoV tells you how even the frame cadence is. It does not tell you whether frames meet the budget. A pipeline can have tiny CoV and still miss v-sync consistently. Interpret CoV together with p95, Average Frame Render Time, DroppedFrames%, and Jank%.
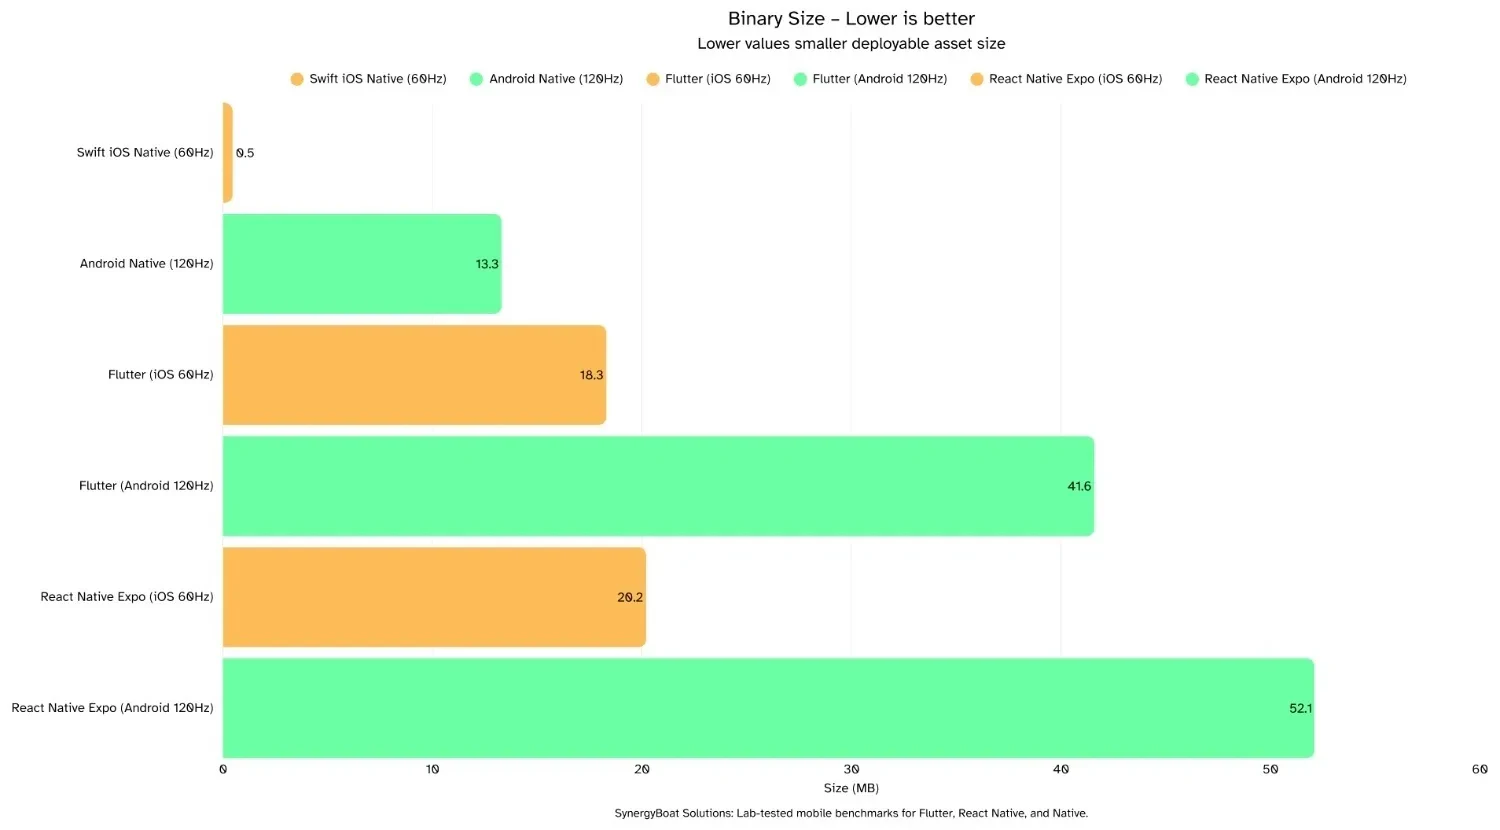
Binary Size
Binary Size is the size of the built app artifacts generated from the project. Lower is better. It affects store download, install time, update bandwidth, and cold start I/O due to package decompression and library loading.
However, single numbers won’t show the full picture. iOS and Android handle frameworks and splitting differently, so absolute sizes are not directly comparable across OS.
Practical rule of thumb: Keep minimal screens in low double digits on Android and sub-20 MB on iOS for cross-platform stacks. Track deltas over time. Sudden jumps usually come from large assets, extra native modules, or disabled shrinkers.
Build Artifact Note: iOS often reports the .ipa or uncompressed .app without dSYMs. Android may be an APK or an AAB that Play splits per ABI and density. React Native with Expo includes runtime components that increase baseline size. Flutter bundles the engine and ICU data, which raises baselines versus pure native.
Insights:
iOS
- Flutter: (18.3 MB)
Typical Flutter baseline for a simple screen. Includes engine and ICU. - React Native (Expo): (20.2 MB)
Highest on iOS. Expo adds convenience plus a larger runtime. - Swift (Native): (0.457 MB)
Extremely small stub that relies on system frameworks. Real apps rise with assets, Swift libs, and features.
Android
- Flutter: (41.6 MB)
Mid-range baseline for a release artifact. Expect smaller effective download from AAB splits. - React Native (Expo): (52.1 MB)
Largest here. Expo runtime and bundled JS raise size. - Android Native (Kotlin): (13.3 MB)
Smallest on Android. Size will scale mainly with assets and any NDK components.
How to read this: iOS native looks tiny because the OS ships most frameworks. Cross-platform stacks bundle a runtime, so baselines are higher. On Android, final user download from the store is often smaller than the raw APK due to AAB splitting. Always pair binary size with TTFF and ΔMemory to avoid trading size for runtime cost.
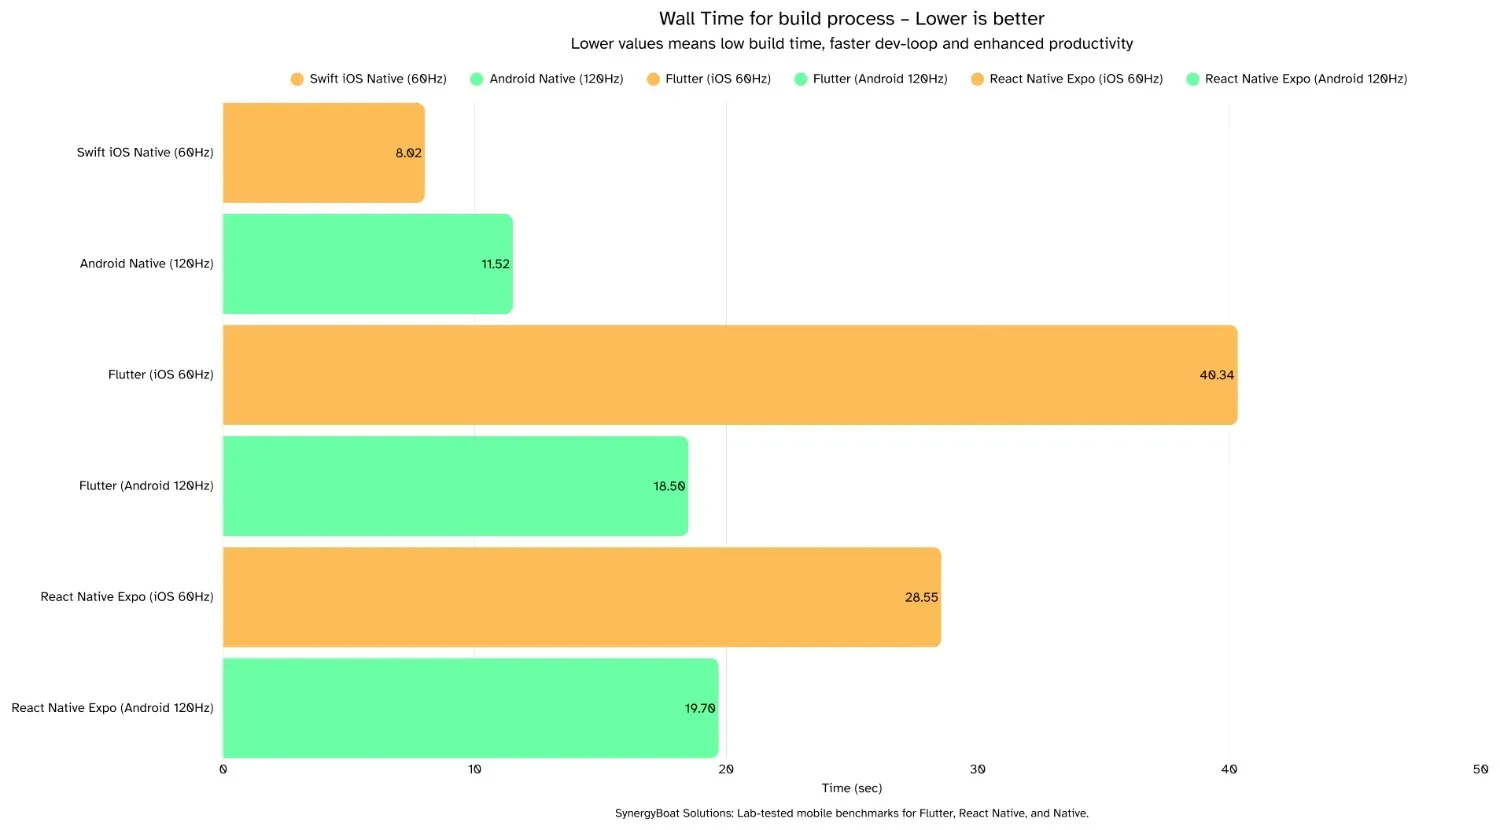
Build Time (inner dev-loop)
Build Time is the wall-clock time from a code change to the next runnable build on device or simulator after a complete stop. Lower is better. It directly impacts developer velocity, iteration cadence, and the number of safe experiments you can run in a day.
Always consider variability across runs and remember that tooling state, caches, and signing can skew results. Compare like for like: same machine, same project state, same build mode.
Insights:
iOS
- Flutter: (40.34 sec ± 0.17)
Slowest iOS loop but very consistent. Engine and asset steps dominate. - React Native (Expo): (28.55 sec ± 2.74)
Mid-pack with higher variance. Metro bundling and signing steps add overhead. - Swift (Native): (8.02 sec ± 1.05)
Fastest loop. Small variance suggests stable incremental builds.
Android
- Flutter: (18.50 sec)
Faster than RN in this run. - React Native (Expo): (19.70 sec)
Slightly slower than Flutter. - Android Native (Kotlin): (11.52 sec ± 0.99)
Fastest loop on Android with tight variance. Good baseline for critical projects.
How to read this: Dev-loop time measures developer experience, not user experience. A 10 to 20 second gap translates into dozens of extra iterations per day.
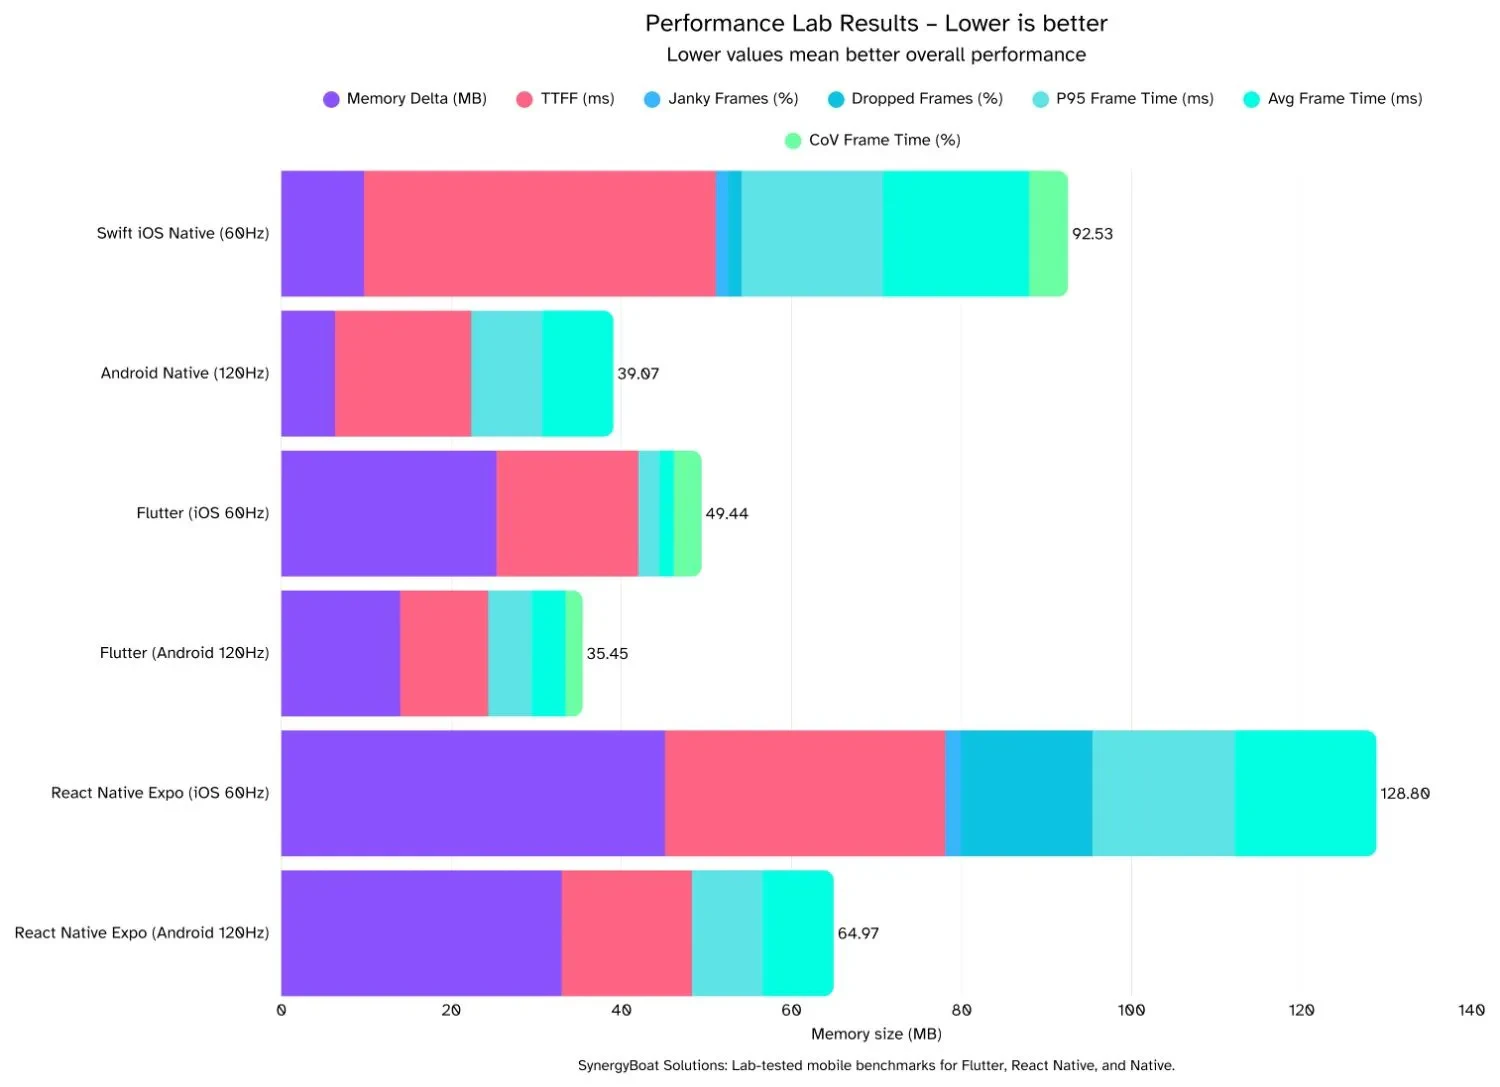
Overall Performance Composite
Overall Performance Composite is a stacked roll-up of key signals from the run: ΔMemory, TTFF, Jank%, DroppedFrames%, p95, Average Frame Time, and CoV. Lower is better. Use it as a quick triage to see which stack carries the smallest combined burden during the benchmarked scroll.
Composite Index Note: This bar combines multiple metrics on a consistent scale so you can compare frameworks at a glance. It is for prioritization, not for absolute claims.
Insights:
iOS (60 Hz)
- Flutter: (Composite 49.44)
Light overall footprint. Driven by very low average and p95 frame times, zero jank and zero drops, with moderate ΔMemory. - React Native: (Composite 128.89)
Heaviest on iOS. Elevated DroppedFrames% and higher ΔMemory inflate the stack. - Swift (Native): (Composite 92.53)
Mid-high burden. Average frame time nudges over budget and there are small but non-zero drops. ΔMemory stays very low.
Android (120 Hz)
- Flutter: (Composite 35.45)
Lowest overall burden. Sub-budget frame times, clean tails, zero drops, and modest ΔMemory produce the smallest stack. - Android Native (Kotlin): (Composite 39.07)
Close second. Near-perfect presentation and low ΔMemory. Any separation from Flutter shows up in p95 and tiny variability. - React Native: (Composite 64.97)
Middle of the pack. At-budget timing with zero drops, but higher ΔMemory grows the bar.
How to read this: Lower bar equals less combined cost. Scan chunk colors to see which metric dominates. Then flip to the matching detailed chart to validate. Use this view to pick where engineering effort pays off fastest.
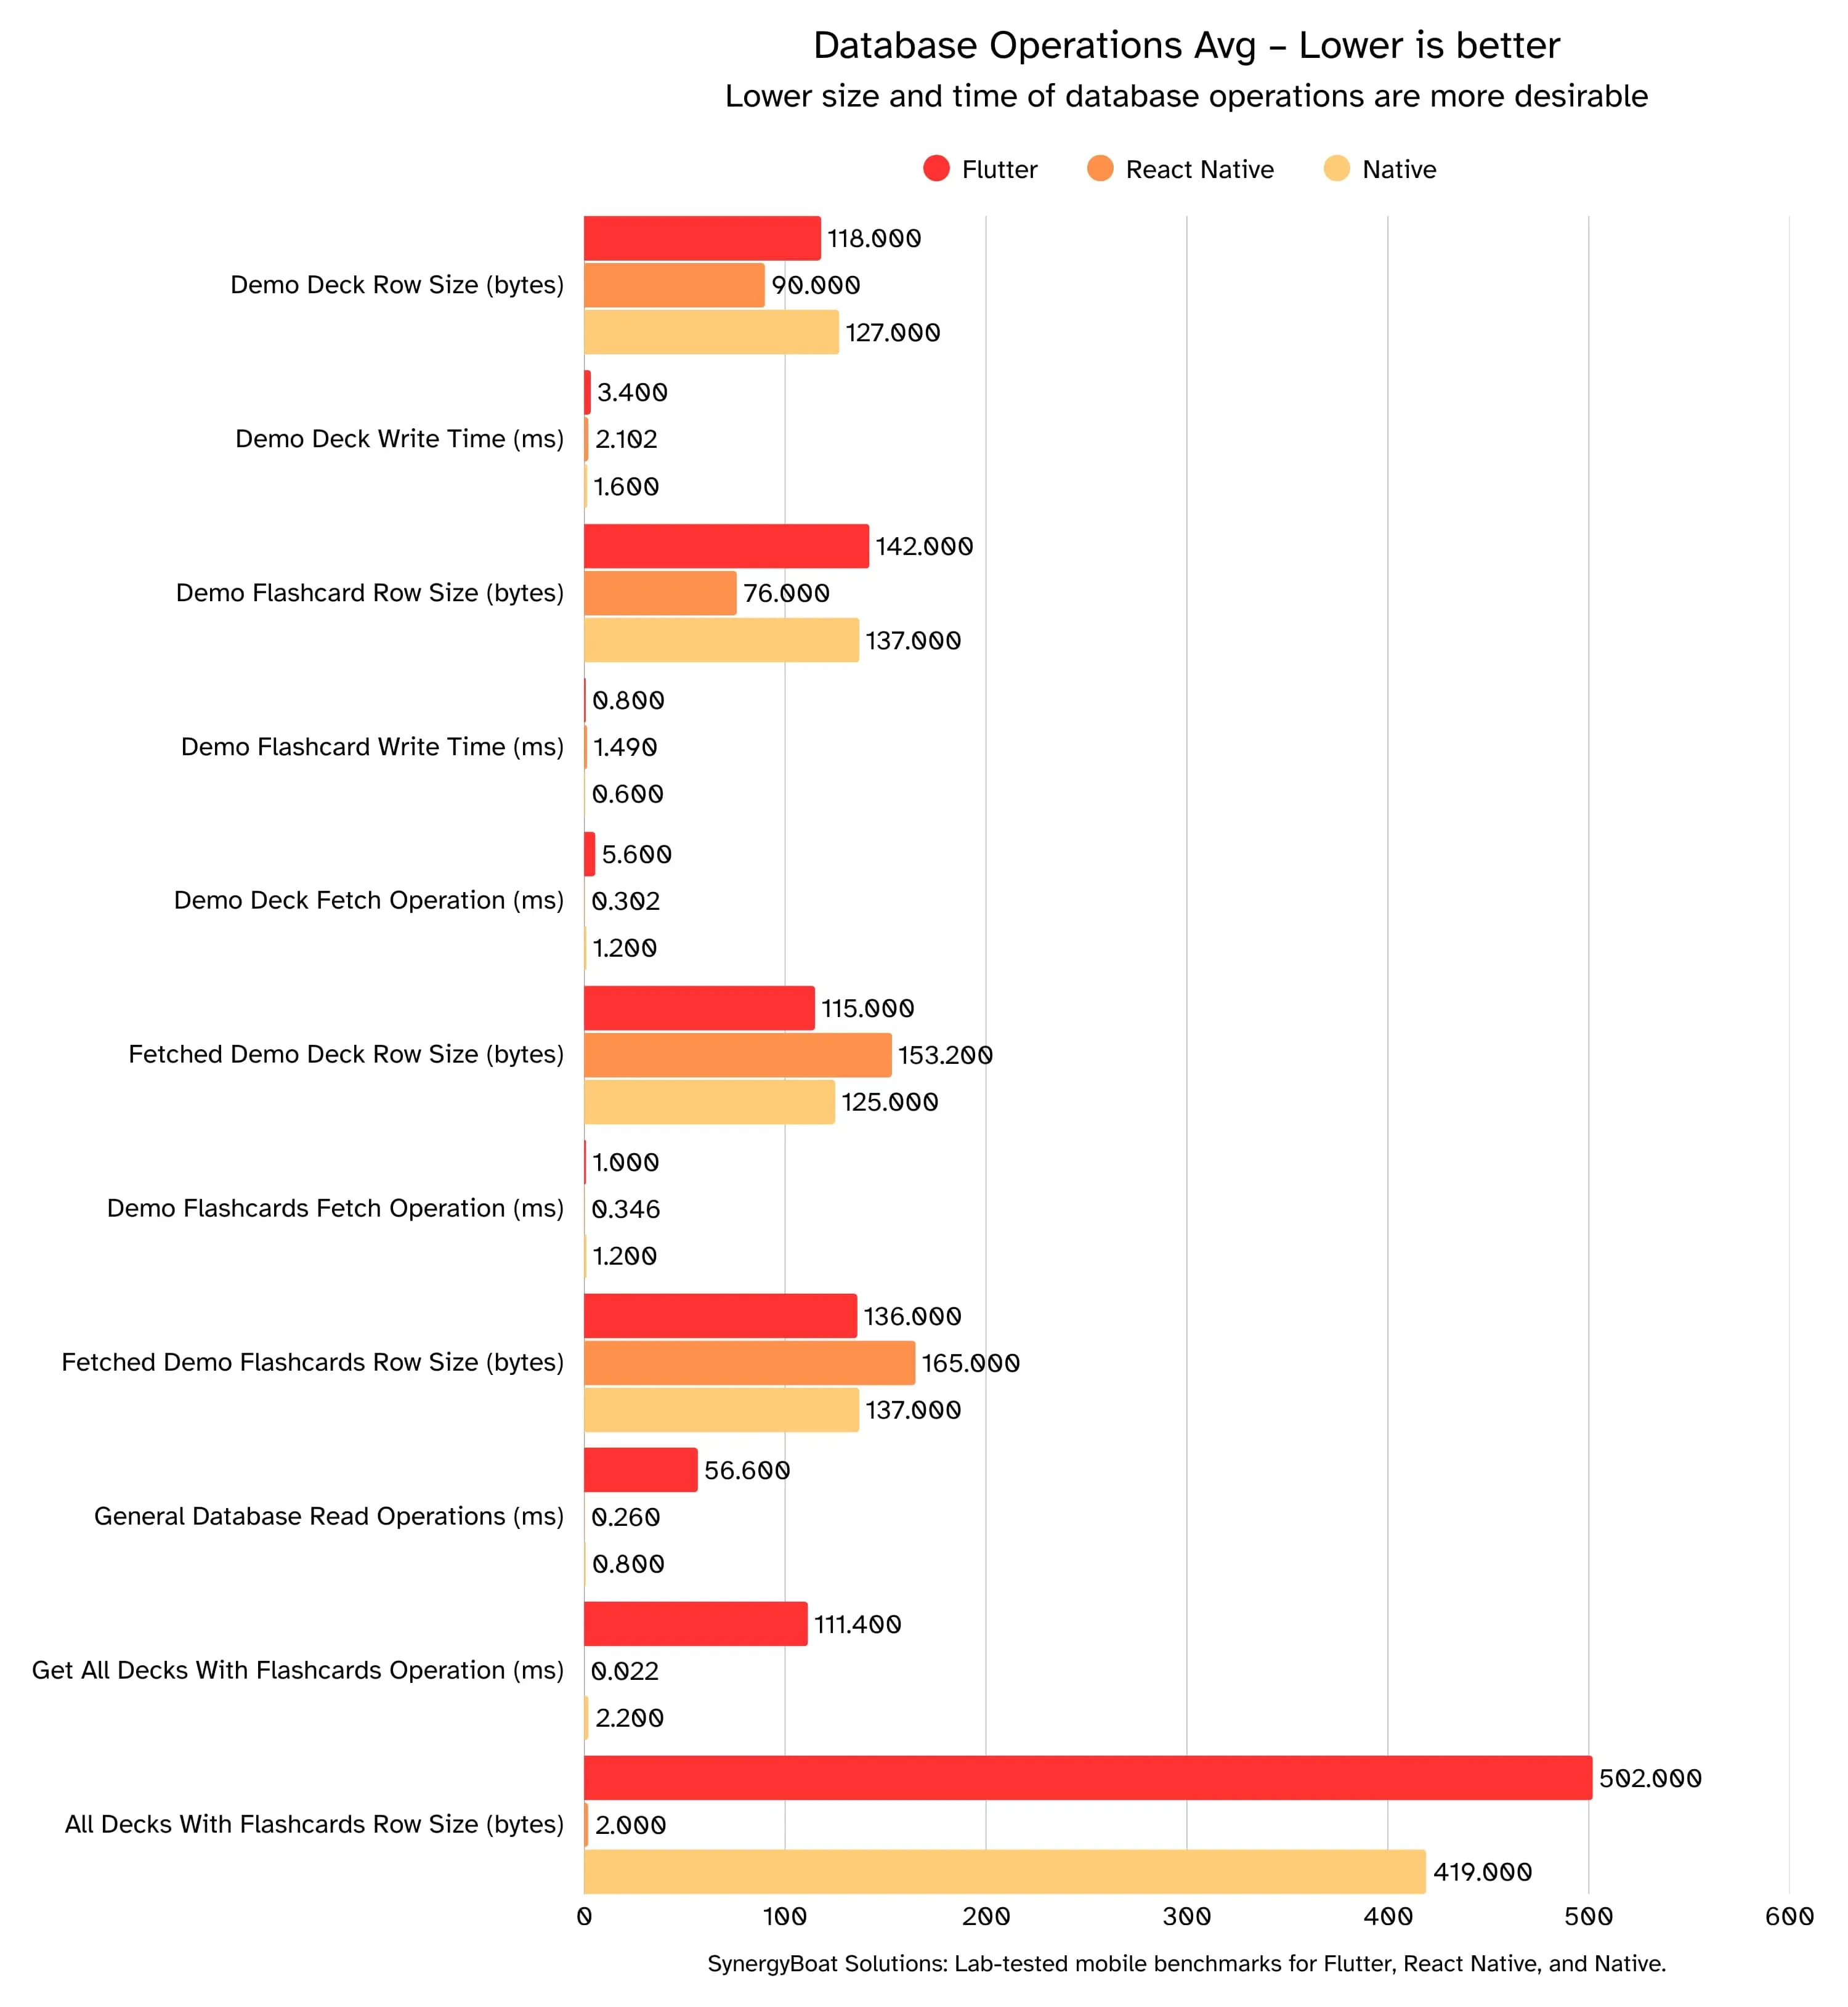
Database operations
What these charts show?
Average times for common reads and writes, plus the average row sizes involved. Lower is better for time and size. This reflects how efficiently each stack moves data during deck and flashcard workflows.
Read DB timings alongside ΔMemory, TTFF, and your frame-time metrics to see whether storage work correlates with UI hitches. Always pair time with the payload size you are moving.
Practical rule of thumb
Keep simple writes under ~5 ms, simple fetches under ~10 ms, and aggregate queries under ~20 ms on a modern device. If averages creep above those ranges, batch operations, index the hot paths, and trim payloads.
DB Measurement Note: These numbers are app-level timings around database calls, not OS-level I/O traces.
Implementation Note: We use an ORM on Flutter and Native, so there is framework overhead on those stacks. React Native (Expo) uses expo-sqlite directly, so there is no ORM layer in RN. This difference can influence absolute timings. Interpret small gaps with that in mind.
Insights:
Flutter (with ORM)
- Writes: Fast, low single-digit ms.
- Targeted reads: Quick for single-deck / flashcards fetches.
- Heavy reads: Slowest of the three on “all decks + flashcards.”
- Why: Larger payloads plus ORM marshalling and broader column selection inflate work.
React Native (direct SQLite, no ORM)
- Writes: Among the fastest. native driver path keeps overhead low.
- Targeted reads: Sub-10 ms tier and consistent.
- Heavy reads: Surprisingly strong on the graph but when normalised with the payloads size, it is near native. Bulk queries also stay low because there’s no ORM hydration cost.
- Why: Direct SQLite via native/JSI bridge, lean result mapping, fewer intermediate objects.
Native (both with ORM)
- Writes: Low single-digit ms, extremely steady.
- Targeted reads: Fastest and tightest variance.
- Heavy reads: Also excellent, near hardware limits with minimal abstraction.
- Why: Direct platform DB APIs; very little to no cross-thread/bridge or ORM overhead.
Takeaways
- Bulk read champs: Native ≈ React Native (no ORM).
- Best “feel” under load: Native (calmest tails).
- Unified-UI trade-off: Flutter is great for targeted reads and DX; opt out of ORM on big joins or paginate to tame the slow path.
- Rule of thumb: Optimize tails, not averages. Trim columns, chunk results, and bypass heavy abstractions where it matters.
Final Takeaway:
Decide by the bad moments, not the averages.
- Pick the stack that stays smooth when things get busy (the worst spikes stay under the time limit, with few stutters or drops).
Flutter
- Biggest headroom across devices; smooth even when busy.
- Trade-off: larger app size; bulk database reads can slow down with an ORM.
- Tuning: turn on Impeller, pre-warm shaders, isolate repaint areas, fetch fewer columns, paginate big lists.
React Native
- Competitive when using the modern pipeline (Fabric + Hermes) and moving hot work off the JS thread.
- Watch: iOS stutters/drops and memory growth under load.
- Tuning: use worklets or RN-Skia for per-frame work, batch state updates, trim packages, fetch only what you need from the DB.
Native (Swift/Kotlin)
- Calmest worst-case behavior and smallest footprint.
- Trade-off: more platform-specific effort.
- Tuning: keep the main thread light, watch GPU overdraw/path complexity, cache smartly.
Quick picks by scenario
- Cross-platform, animation-heavy UI → Flutter.
- Regulated/latency-sensitive, tiny binaries, deep platform hooks → Native.
- Web-leaning team, fast shipping → React Native (use the modern renderer and engine).
Set simple guardrails
- Keep average frame time comfortably under the 16.7 ms (60 Hz) or 8.3 ms (120 Hz) limit.
- Keep stutters under ~1–2% of frames and dropped frames near zero.
- Track memory growth on key screens and keep it steady.
If the averages look equal, pick the stack with more spare room and smaller spikes. That’s the one that stays smooth when real users do messy things.
In practice, the right framework choice is rarely about benchmarks alone. It is about how product goals, engineering capacity, and long-term performance expectations fit together. We help teams make those platform decisions early, improve mobile performance where it matters, and build products that hold up in production.
For teams making this choice in the context of launch speed, team structure, and long-term product strategy, this companion guide translates the same benchmark findings into practical decision criteria.
Benchmarks are numbers. Strategy is about what you do with them. The lesson from our study is simple:
Don’t pick a framework because it wins on averages. Pick the one that fits your product’s lifecycle, team DNA, and performance tolerance.
- If you’re targeting consumer-grade apps with rich animations or data-heavy dashboards, Flutter’s headroom gives you breathing space to innovate without worrying about dropped frames.
- If your app demands tight platform alignment, smaller binaries, and direct access to native APIs (think financial apps, system utilities, or OEM partnerships), Native is still your gold standard.
- If your team leans web-first and speed-to-market is the priority, React Native can deliver, but you’ll need to actively budget for iOS stability and memory optimization.
The broader insight is that runtime tails, not averages, define user experience. Optimize for P95 latency, dropped frames, and memory growth, that’s where frustration or delight lives.
Tool choice is not permanent. Flutter, React Native, and Native can co-exist in your portfolio. The right strategy is knowing when to double down, when to hybridize, and when to pivot.
Ship smoother, faster, smarter.
Choose your boost:
- Decision Workshop (Pick the right stack with a risk matrix and a 90-day plan)
- Performance Lab (Benchmarks your app with a tails-focused report, flame graphs, and a ranked fix list),
- Dev-Loop Acceleration (Cut build time and ship fast)
- Runtime Hardening (Hit p95 and low Jank targets with guardrails and measurable wins)
- Agentic UX & AI (on-device retrieval and agent flows that respect your frame budget)
Reply with your app type, current framework, target devices, and biggest performance pain, and we will map a quick win and a path to excellent user experience.
Email us at ahoy@synergyboat.com or visit Synergyboat.com